Below are the projects that I have worked on. Projects are labeled Level 1 (Basic), Level 2 (Intermediate), and Level 3 (Advanced) based on the amount and difficulty of programming skills used. The levels are assigned according to my programming abilities and knowledge.
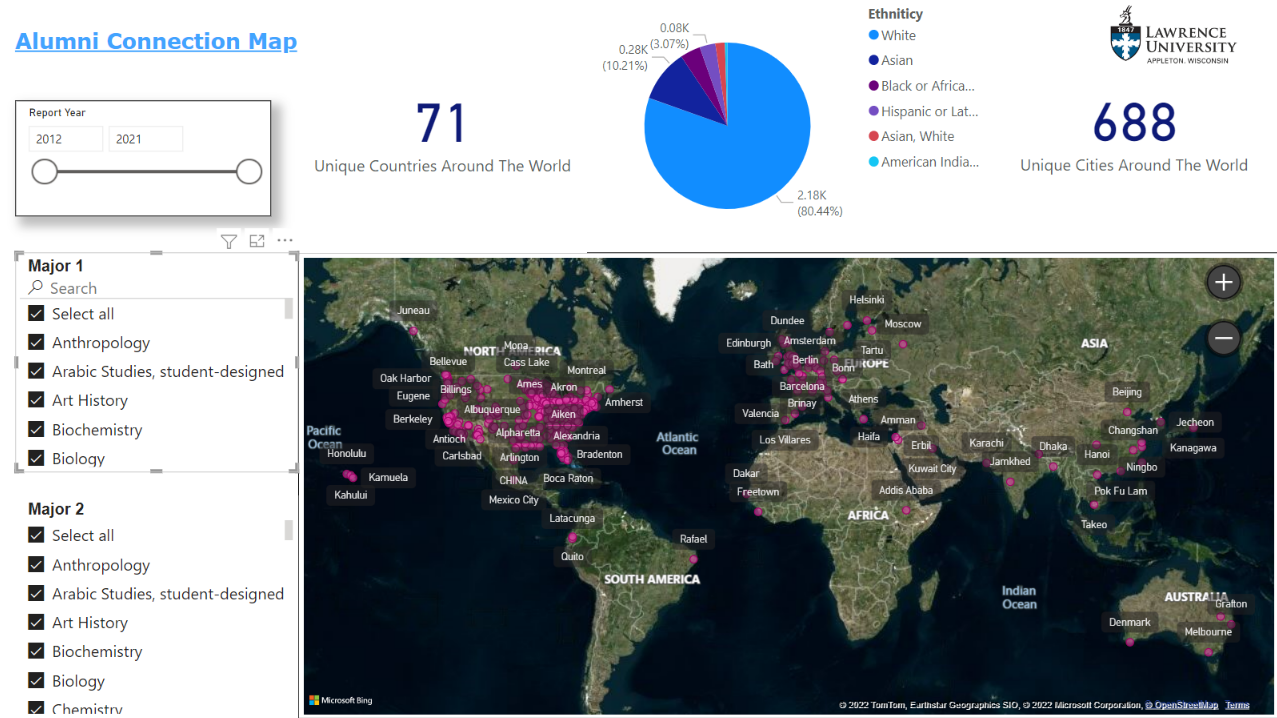
Project 1: Power BI Dashboard : Alumni Location (Level 2)
- Extensive use of R and Power BI Query for data wrangling and feature engineering
- An interactive dashboard that lets end user observe where Lawrence University Alumnis are located post graduation.
- It let’s users filter by preferred major, alumni graduation date, and ethnicity.
Project 2: Machine Learning Project : Spam Classifier (Level 3)
- Project aims to figure out the best Spam Email Classifying algorithm within the algorithms used based on misclassification rates and true negatives.
- Data set collected at Hewlett-Packard Labs, classifies 4601 e-mails as spam or non-spam.
- Optimal Choice : Bagging and Support Vectom Machine with linear Kernel - misclassification error rate of 12% (lowest among all models and approaches) and only 2 (lowest among all models and approaches) non spam emails being classified as spam emails.
Classifiers Used:
- Logistic Regression
- Linear Discriminant Analysis
- K Nearest Neighbour
- Decision Trees : Pruned Class Tree, Bagging, Random Forest
- Support Vector Machines: Linear, Polynomial, and Radial Kernels


Project 3: Econometrics - Panel-Data Project (Level 3)
Panel-data project (PP) exploring exploring 2020 US Presidential Election results at the county level, together with county-level demographic data
- data obtained from the 2019 ACS 5-Year via the tidycensus package.
- Big Data cleaning, tidying, joining, manipulating, and feature engineering
- Creating Interactive U.S Maps
- Simpe Linear Regression , Multiple Linear Regression


Project 4: Bookdown - R, SQL, Web Scraping (Level 2)
A book that I assembled upon completion of DataCamp Courses with notes and examples on the basics of R, SQL and Web Scraping.
- Introduction and Intermediate R
- Introduction to the Tidyverse, Data Visualization with ggplot2
- Categorical & Quantitative Data
- Cleaning, Joining and Data Manipulation(Basic Feature Engieering)
- Introduction to SQL
- Joining Data in SQL
- Web Scraping in R
- Simpe Linear Regression , Multiple Linear Regression
- Dummy Variable, Fixed Effects, Difference-in-Differences
Project 5: The iPhone Overview (Level 2)
- An R Shiny App which helps users visualize the Sales, Battery Life, and Launch Price for each type of model of iPhones since the iPhone 3gs.
- Data gathered through Web Scraping using Selector Gadget
- Project includes Data Taming, Data Tidying, Data Transformation, Data Manipulation, and Joining Data
- Project includes advanced ggplot graphs
- User gets to switch between 2 Types of graphs (Scatterplots connected by segments and a user initiated correlation)
- Type 1 graph helps users visualize the Sales, Battery Life, and Launch Price for each type of model of iPhones since iPhone 3g
- Type 2 graph shows the correlations between any two among the 4 variables which the user chooses through the Shiny App
- Project strictly for implementation of R-Shiny, Web Scraping, Data Manupulation, and GGplot abilities. Plot conclusions may/may not be accurate due to insufficient data.
Type 1 Graph

Type 2 Graph

Project 6: Amazon Books Best Sellers (Level 1)
- Short Blog on Yearly Best Selling Books by Amazon from years (2009 - 2019)
- Data Collected from Kaggle
- Basic data cleaning, data manipulation, feature engineering, data visualization
- Used ggplot and ggplotly to create Interactive Plot
- Project strictly for implementation of ggplot and ggplotly abilities. Blog and plot conclusions may/may not be accurate due to insufficient data.
